Azure Usage Reports
The Azure Usage Report provides a detailed summary of the Azure resources utilized during a billing cycle.
-
Navigate to My Services > Microsoft Azure > Usage Report
-
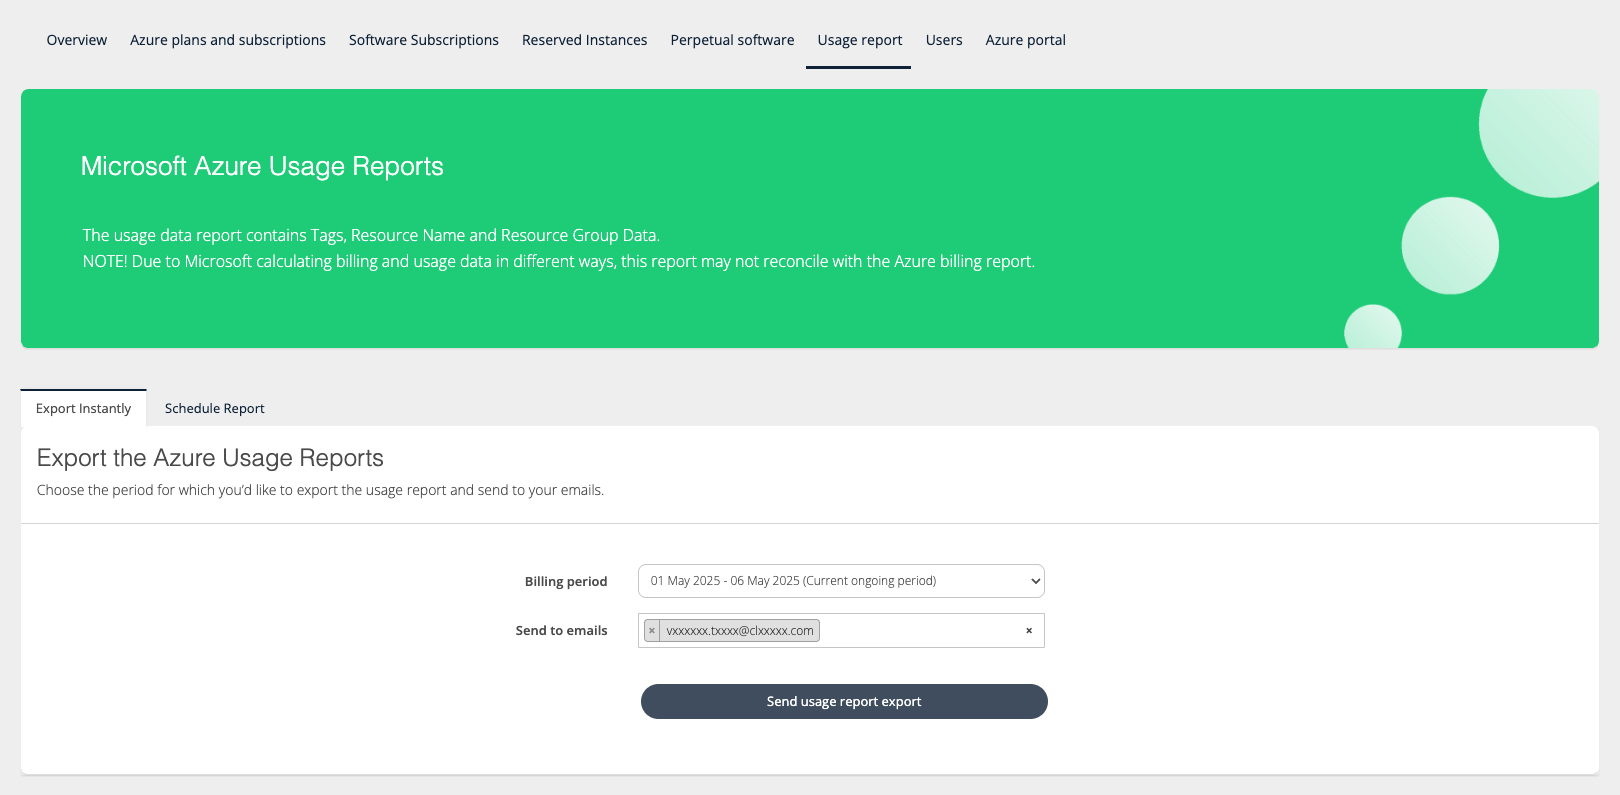
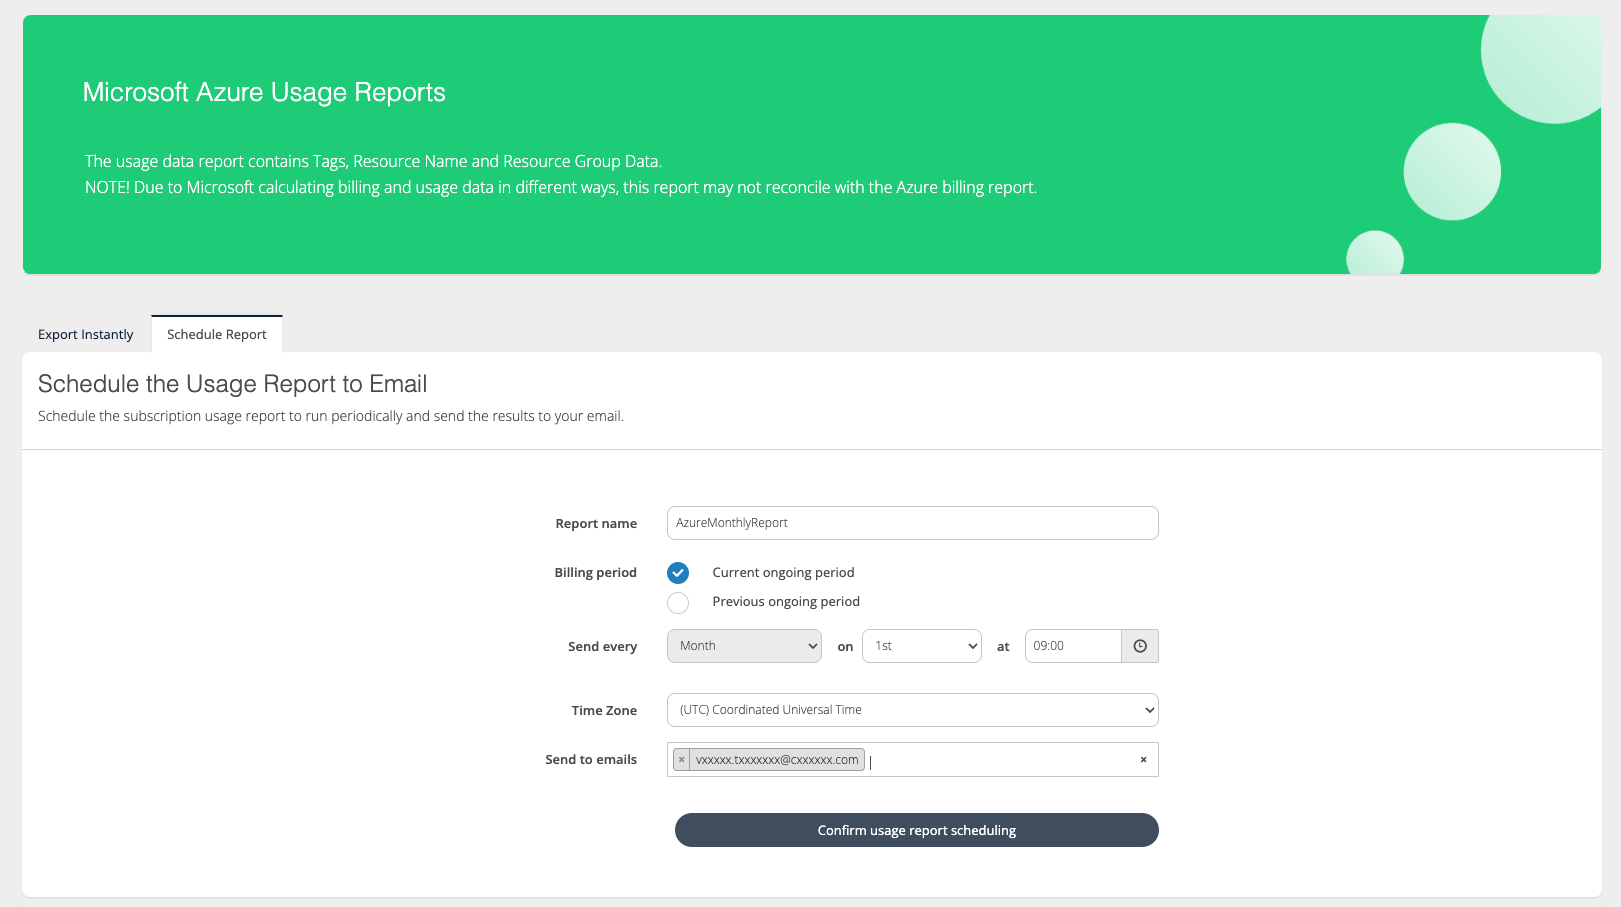
There are two options: Export Instantly and Schedule Report
-
Export Instantly - Choose the period for which you’d like to export the usage report and send to your email.
-
Schedule Reports - Schedule the subscription usage report to run periodically and send the results to your email.
Consumption Usage Report on Organization Level
|
Roles → |
Broker Admin roles |
Key Account Manager roles |
Sales Agent role |
Organization Admin |
|---|---|---|---|---|
|
OrganizationId |
|
|
|
|
|
OrganizationName |
|
|
|
|
|
MicrosoftCustomerId |
|
|
|
|
|
CloudmoreCustomerNumber |
|
|
|
|
|
ProductName |
|
|
|
|
|
ProductId |
|
|
|
|
|
Sku |
|
|
|
|
|
SkuName |
|
|
|
|
|
CustomerCountry |
|
|
|
|
|
SubscriptionId |
|
|
|
|
|
SubscriptionDescription |
|
|
|
|
|
EntitlementId |
|
|
|
|
|
EntitlementDescription |
|
|
|
|
|
ChargeStartDate |
|
|
|
|
|
ChargeEndDate |
|
|
|
|
|
Quantity |
|
|
|
|
|
UnitPrice |
|
|
|
|
|
Total |
|
|
|
|
|
InvoiceCurrency |
|
|
|
|
|
BillingProvider |
|
|
|
|
|
PublisherName |
|
|
|
|
|
MeterCategory |
|
|
|
|
|
MeterSubCategory |
|
|
|
|
|
MeterId |
|
|
|
|
|
MeterName |
|
|
|
|
|
MeterRegion |
|
|
|
|
|
MeterType |
|
|
|
|
|
UsageStartDate |
|
|
|
|
|
UsageEndDate |
|
|
|
|
|
ChargeType |
|
|
|
|
|
Tags |
|
|
|
|
|
ResourceName |
|
|
|
|
|
ResourceGroup |
|
|
|
|
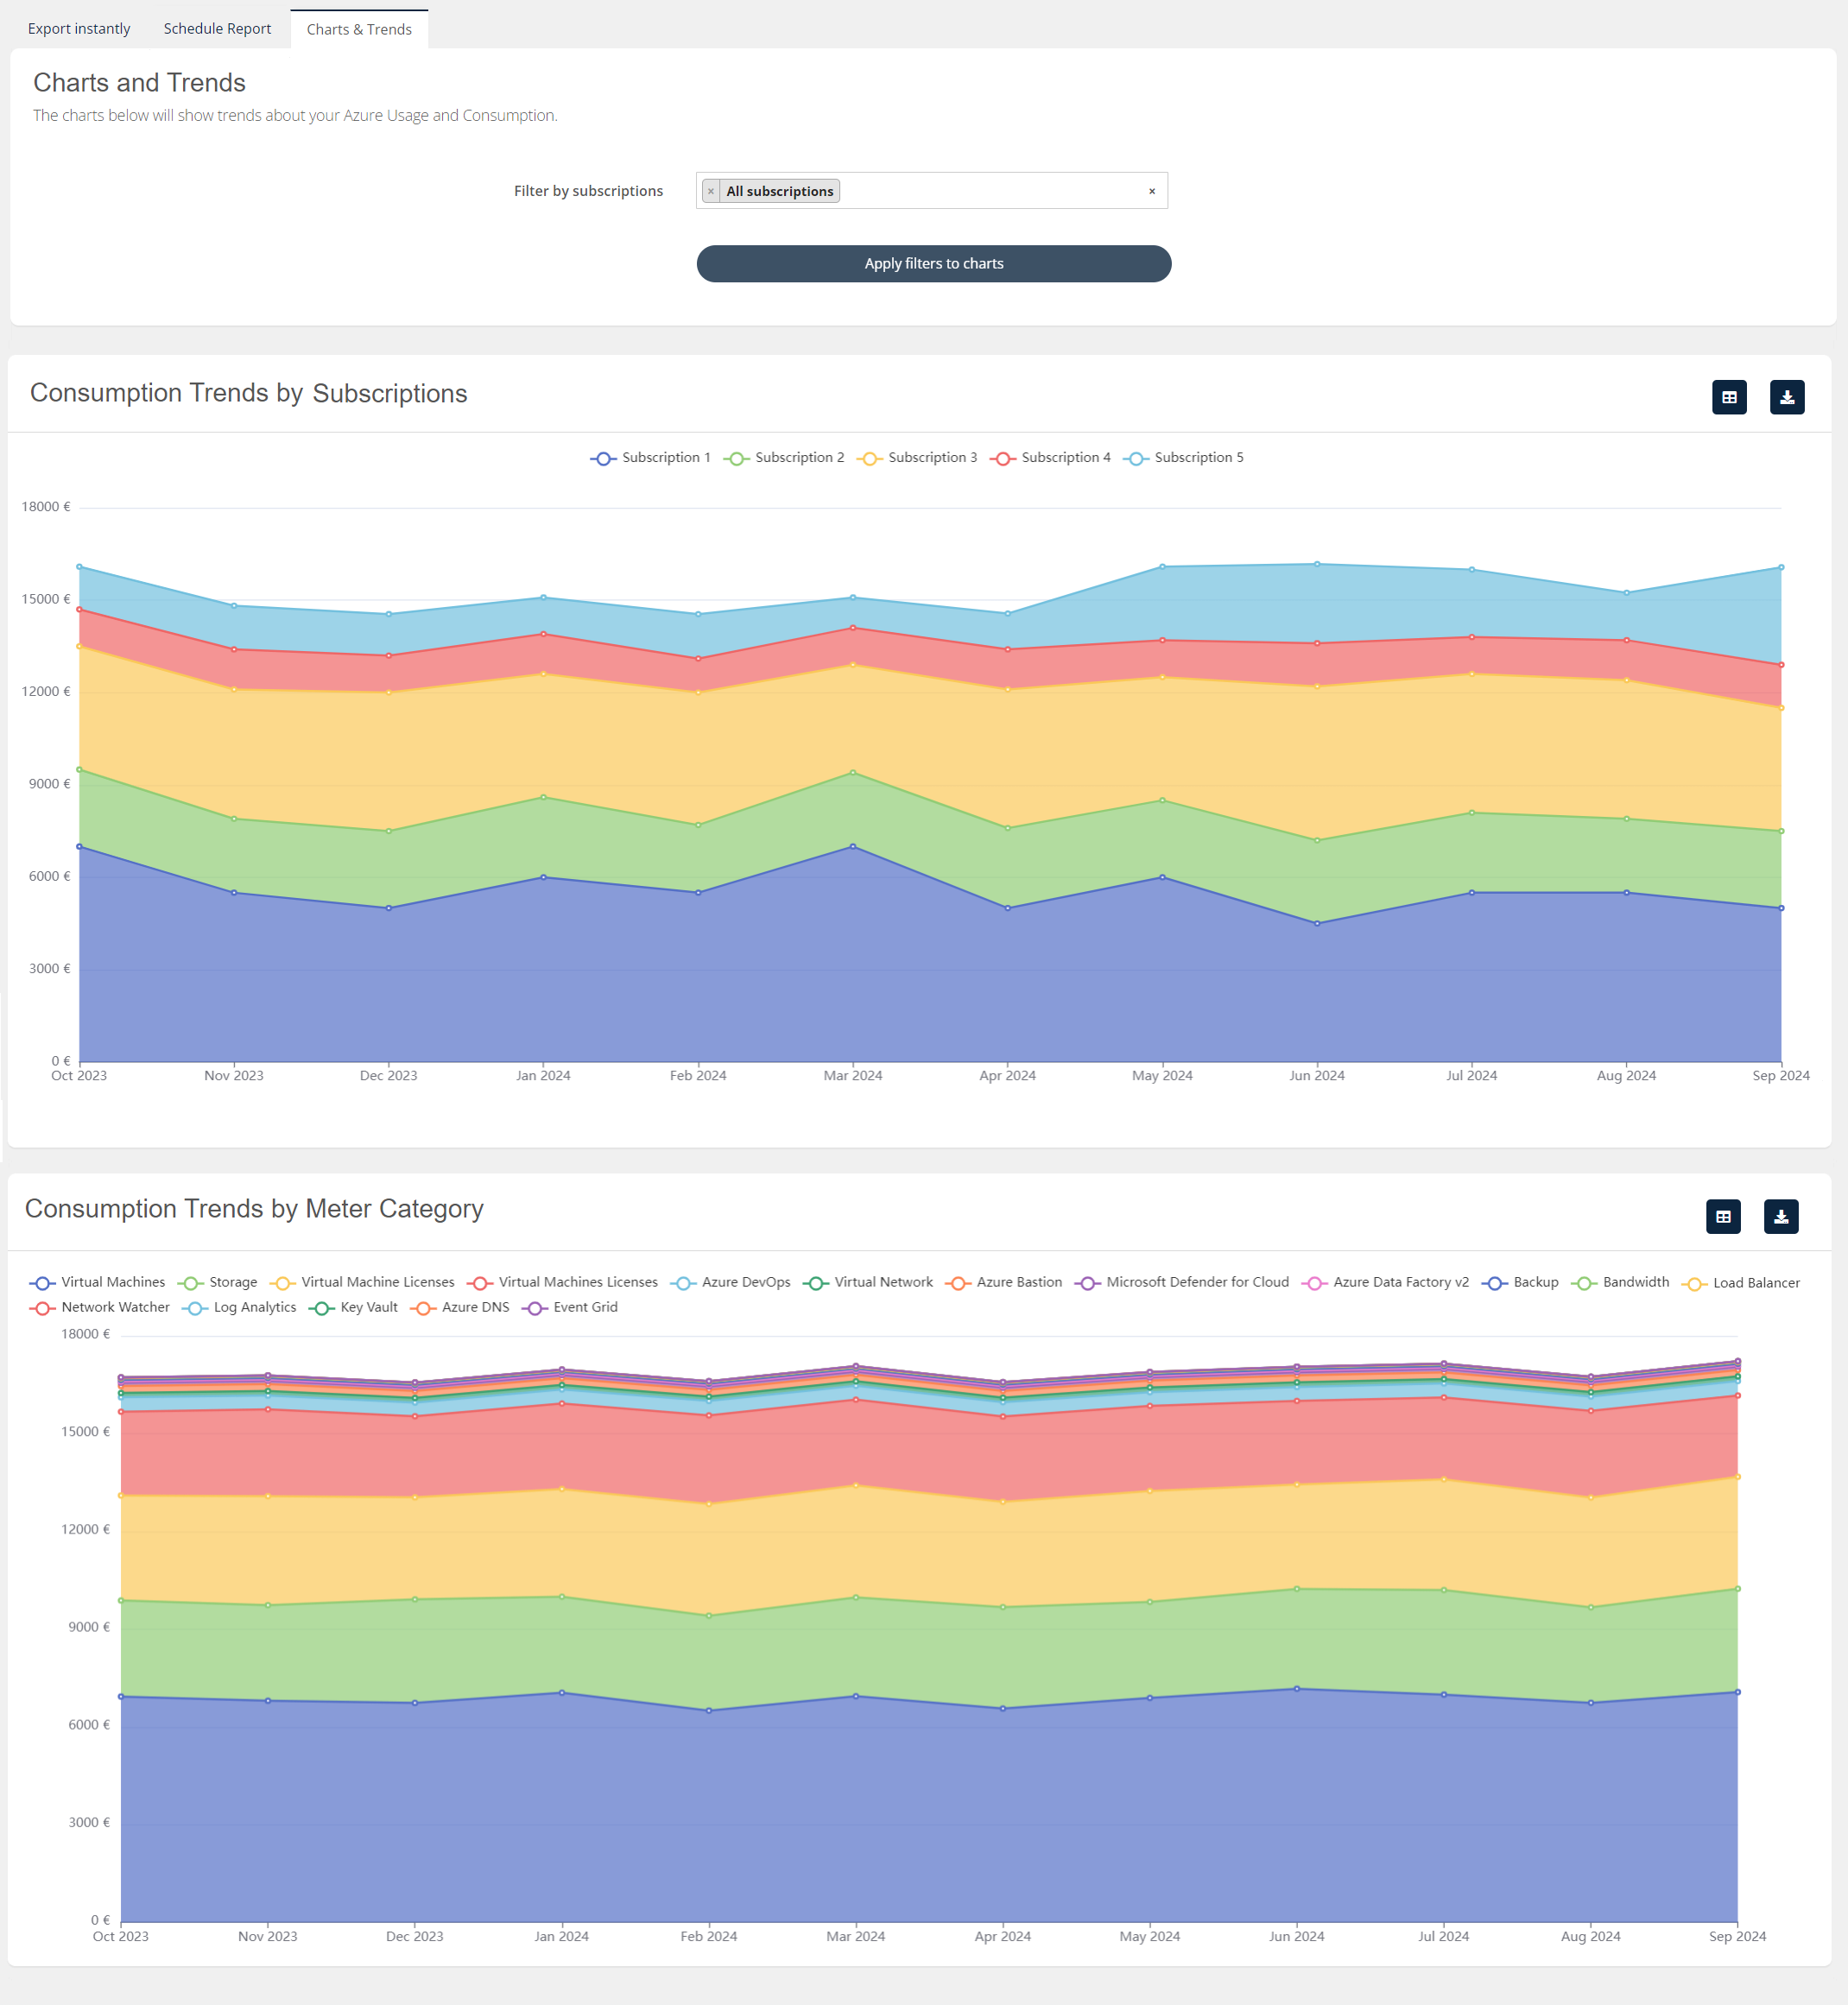
Azure Usage Charts
This provides an interactive visual overview of their usage data directly on the platform, eliminating the need to download detailed reports. The charts are divided into two sections:
-
Split by Subscription: Shows how costs for each subscription are changing over time.
-
Split by Meter Category: Displays which resource types are driving the highest costs and how these costs are evolving.